Loading NFL data...
Top 25 · 420 candidates
| Rank | Candidate | Season line | Weekly move | Performance rank | Win probability |
|---|---|---|---|---|---|
| 1 | Jaxon Smith-NjigbaSEA · WR2 games played. Projected finish: 2,024.2 receiving yards · 19.9 receiving TDs. Shrunk competitive EPA above a positional baseline: 0.21. Main forecast factors
Factors describe the fitted model, not a causal explanation of voters. | 277 rec yds, 4 TD | +5 | #55 | Experimental |
| 2 | Josh AllenBUF · QB2 games played. Projected finish: 4,329.5 passing yards · 33.1 passing TDs. Shrunk competitive EPA above a positional baseline: 6.83. Main forecast factors
Factors describe the fitted model, not a causal explanation of voters. | 582 pass yds, 5 TD, 0 INT · 92 rush yds, 4 TD | -1 | #1 | Experimental |
| 3 | Jahmyr GibbsDET · RB2 games played. Projected finish: 1,447.4 rushing yards · 14.7 rushing TDs. Shrunk competitive EPA above a positional baseline: 3.42. Main forecast factors
Factors describe the fitted model, not a causal explanation of voters. | 208 rush yds, 2 TD · 91 rec yds, 1 TD | -1 | #7 | Experimental |
| 4 | Kenneth Walker IIIKC · RB2 games played. Projected finish: 1,619.1 rushing yards · 6.4 rushing TDs. Shrunk competitive EPA above a positional baseline: 5.88. Main forecast factors
Factors describe the fitted model, not a causal explanation of voters. | 290 rush yds, 1 TD · 79 rec yds, 1 TD | +11 | #2 | Experimental |
| 5 | Patrick MahomesKC · QB2 games played. Projected finish: 4,543.1 passing yards · 33.2 passing TDs. Shrunk competitive EPA above a positional baseline: 3.32. Main forecast factors
Factors describe the fitted model, not a causal explanation of voters. | 566 pass yds, 5 TD, 1 INT · 40 rush yds, 1 TD | +4 | #8 | Experimental |
| 6 | Brock PurdySF · QB2 games played. Projected finish: 4,129.8 passing yards · 39.7 passing TDs. Shrunk competitive EPA above a positional baseline: 4.16. Main forecast factors
Factors describe the fitted model, not a causal explanation of voters. | 492 pass yds, 5 TD, 1 INT · 59 rush yds, 1 TD | +8 | #5 | Experimental |
| 7 | Bijan RobinsonATL · RB2 games played. Projected finish: 1,411.9 rushing yards · 4.1 rushing TDs. Shrunk competitive EPA above a positional baseline: 0.50. Main forecast factors
Factors describe the fitted model, not a causal explanation of voters. | 155 rush yds, 0 TD · 99 rec yds, 1 TD | -2 | #39 | Experimental |
| 8 | Christian McCaffreySF · RB2 games played. Projected finish: 1,025.6 rushing yards · 12.9 rushing TDs. Shrunk competitive EPA above a positional baseline: 0.97. Main forecast factors
Factors describe the fitted model, not a causal explanation of voters. | 91 rush yds, 2 TD · 63 rec yds, 0 TD | -1 | #29 | Experimental |
| 9 | Jonathan TaylorIND · RB2 games played. Projected finish: 1,597.4 rushing yards · 24.6 rushing TDs. Shrunk competitive EPA above a positional baseline: 2.38. Main forecast factors
Factors describe the fitted model, not a causal explanation of voters. | 190 rush yds, 4 TD · 63 rec yds, 0 TD | +2 | #14 | Experimental |
| 10 | James CookBUF · RB2 games played. Projected finish: 1,625.5 rushing yards · 10.6 rushing TDs. Shrunk competitive EPA above a positional baseline: 2.72. Main forecast factors
Factors describe the fitted model, not a causal explanation of voters. | 192 rush yds, 1 TD · 16 rec yds, 0 TD | +8 | #12 | Experimental |
| 11 | Derrick HenryBAL · RB2 games played. Projected finish: 1,680.2 rushing yards · 23.4 rushing TDs. Shrunk competitive EPA above a positional baseline: 3.65. Main forecast factors
Factors describe the fitted model, not a causal explanation of voters. | 212 rush yds, 4 TD · 38 rec yds, 0 TD | -8 | #6 | Experimental |
| 12 | Jalen HurtsPHI · QB2 games played. Projected finish: 3,649.5 passing yards · 33.1 passing TDs. Shrunk competitive EPA above a positional baseline: 2.74. Main forecast factors
Factors describe the fitted model, not a causal explanation of voters. | 467 pass yds, 5 TD, 2 INT · 62 rush yds, 0 TD | +4 | #11 | Experimental |
| 13 | Dak PrescottDAL · QB2 games played. Projected finish: 4,266.7 passing yards · 38.7 passing TDs. Shrunk competitive EPA above a positional baseline: 4.19. Main forecast factors
Factors describe the fitted model, not a causal explanation of voters. | 454 pass yds, 6 TD, 1 INT · 40 rush yds, 0 TD | +25 | #4 | Experimental |
| 14 | Amon-Ra St. BrownDET · WR2 games played. Projected finish: 1,555.6 receiving yards · 20.5 receiving TDs. Shrunk competitive EPA above a positional baseline: -0.35. Main forecast factors
Factors describe the fitted model, not a causal explanation of voters. | 209 rec yds, 4 TD | +16 | #338 | Experimental |
| 15 | Chris OlaveNO · WR2 games played. Projected finish: 1,664.9 receiving yards · 9.1 receiving TDs. Shrunk competitive EPA above a positional baseline: -0.08. Main forecast factors
Factors describe the fitted model, not a causal explanation of voters. | 268 rec yds, 1 TD | +7 | #278 | Experimental |
| 16 | D'Andre SwiftCHI · RB2 games played. Projected finish: 1,270.9 rushing yards · 16.1 rushing TDs. Shrunk competitive EPA above a positional baseline: 1.46. Main forecast factors
Factors describe the fitted model, not a causal explanation of voters. | 169 rush yds, 3 TD · 64 rec yds, 0 TD | -8 | #19 | Experimental |
| 17 | Jared GoffDET · QB2 games played. Projected finish: 4,550.2 passing yards · 41 passing TDs. Shrunk competitive EPA above a positional baseline: -0.11. Main forecast factors
Factors describe the fitted model, not a causal explanation of voters. | 533 pass yds, 6 TD, 0 INT · 9 rush yds, 0 TD | +6 | #295 | Experimental |
| 18 | Ashton JeantyLV · RB2 games played. Projected finish: 1,098.5 rushing yards · 2.9 rushing TDs. Shrunk competitive EPA above a positional baseline: -0.29. Main forecast factors
Factors describe the fitted model, not a causal explanation of voters. | 150 rush yds, 0 TD · 60 rec yds, 2 TD | +3 | #332 | Experimental |
| 19 | Caleb WilliamsCHI · QB2 games played. Projected finish: 3,743.3 passing yards · 22.9 passing TDs. Shrunk competitive EPA above a positional baseline: 4.22. Main forecast factors
Factors describe the fitted model, not a causal explanation of voters. | 407 pass yds, 2 TD, 1 INT · 107 rush yds, 2 TD | -15 | #3 | Experimental |
| 20 | Bryce YoungCAR · QB2 games played. Projected finish: 4,149.9 passing yards · 35.4 passing TDs. Shrunk competitive EPA above a positional baseline: 1.56. Main forecast factors
Factors describe the fitted model, not a causal explanation of voters. | 648 pass yds, 6 TD, 1 INT · 16 rush yds, 1 TD | +13 | #18 | Experimental |
| 21 | Matthew StaffordLA · QB2 games played. Projected finish: 4,455.8 passing yards · 41.1 passing TDs. Shrunk competitive EPA above a positional baseline: 0.50. Main forecast factors
Factors describe the fitted model, not a causal explanation of voters. | 482 pass yds, 4 TD, 2 INT | +33 | #40 | Experimental |
| 22 | CeeDee LambDAL · WR2 games played. Projected finish: 1,518 receiving yards · 12.8 receiving TDs. Shrunk competitive EPA above a positional baseline: -0.04. Main forecast factors
Factors describe the fitted model, not a causal explanation of voters. | 197 rec yds, 3 TD | +46 | #261 | Experimental |
| 23 | Lamar JacksonBAL · QB2 games played. Projected finish: 3,917.3 passing yards · 23.2 passing TDs. Shrunk competitive EPA above a positional baseline: 3.31. Main forecast factors
Factors describe the fitted model, not a causal explanation of voters. | 559 pass yds, 2 TD, 1 INT · 74 rush yds, 1 TD | -10 | #9 | Experimental |
| 24 | Breece HallNYJ · RB2 games played. Projected finish: 1,124.1 rushing yards · 6 rushing TDs. Shrunk competitive EPA above a positional baseline: 1.72. Main forecast factors
Factors describe the fitted model, not a causal explanation of voters. | 131 rush yds, 1 TD · 79 rec yds, 0 TD | -5 | #16 | Experimental |
| 25 | Chase BrownCIN · RB2 games played. Projected finish: 1,075.4 rushing yards · 7 rushing TDs. Shrunk competitive EPA above a positional baseline: 0.62. Main forecast factors
Factors describe the fitted model, not a causal explanation of voters. | 136 rush yds, 1 TD · 24 rec yds, 0 TD | 0 | #38 | Experimental |







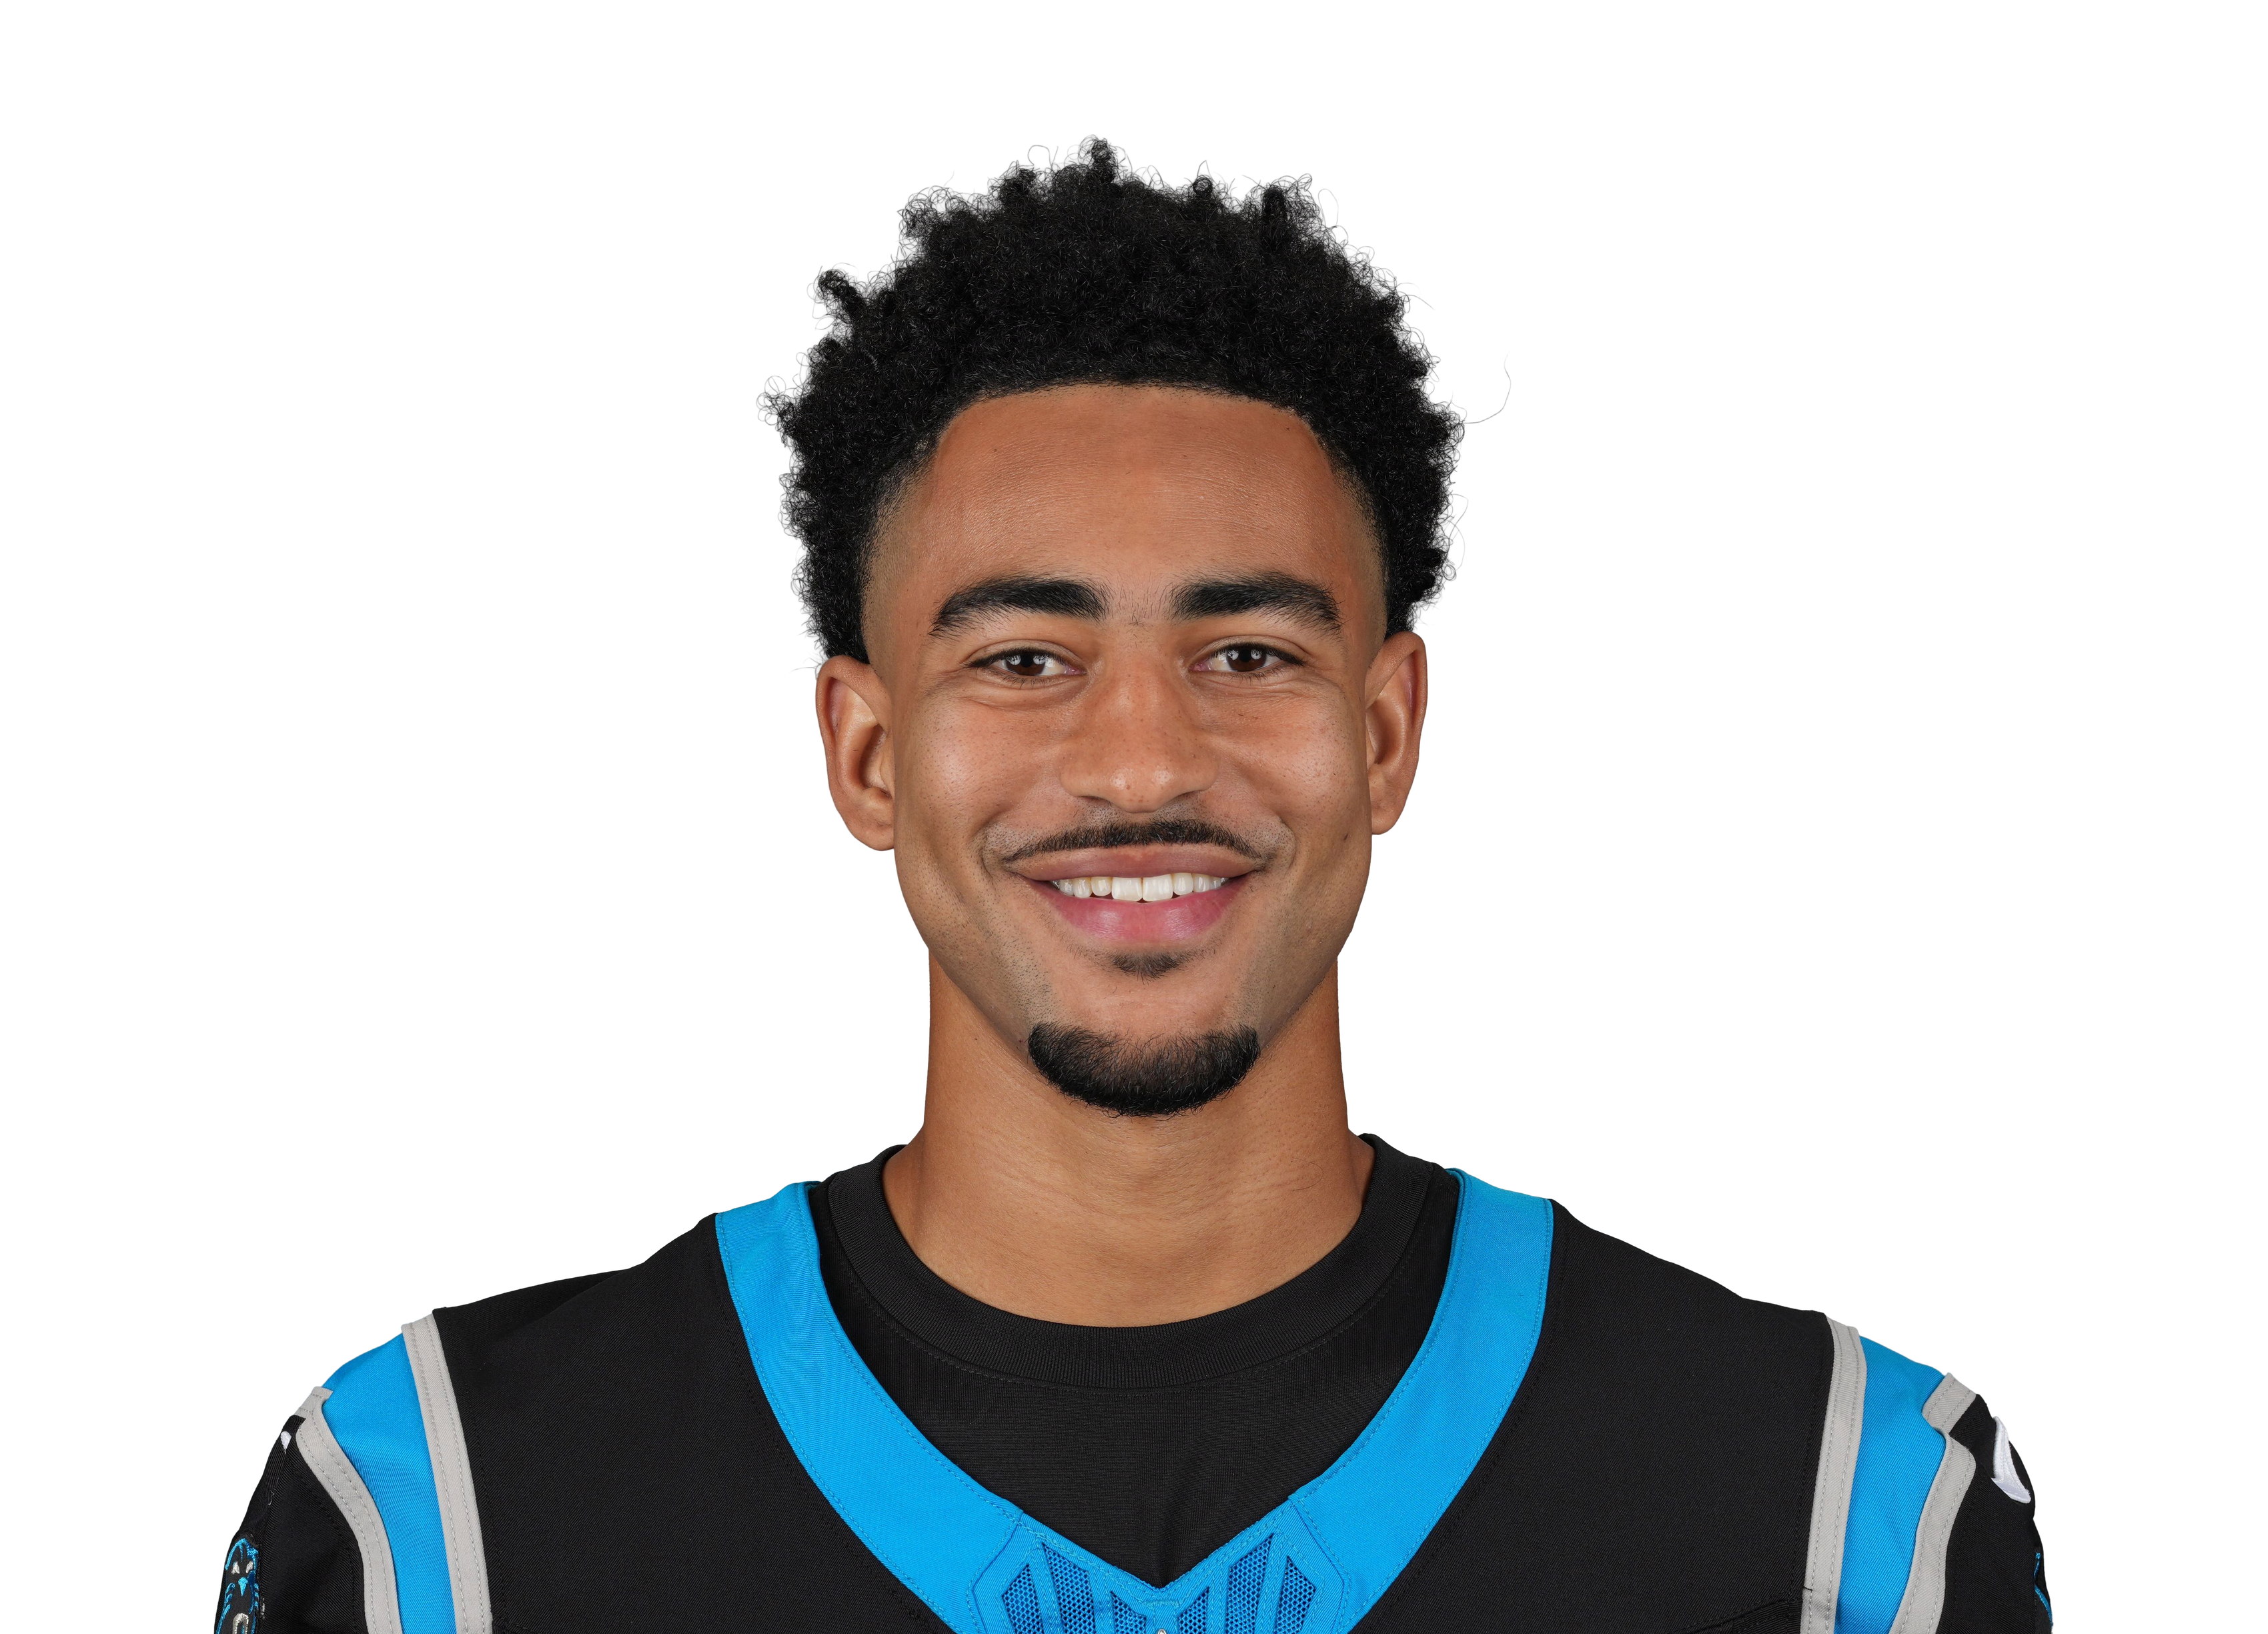

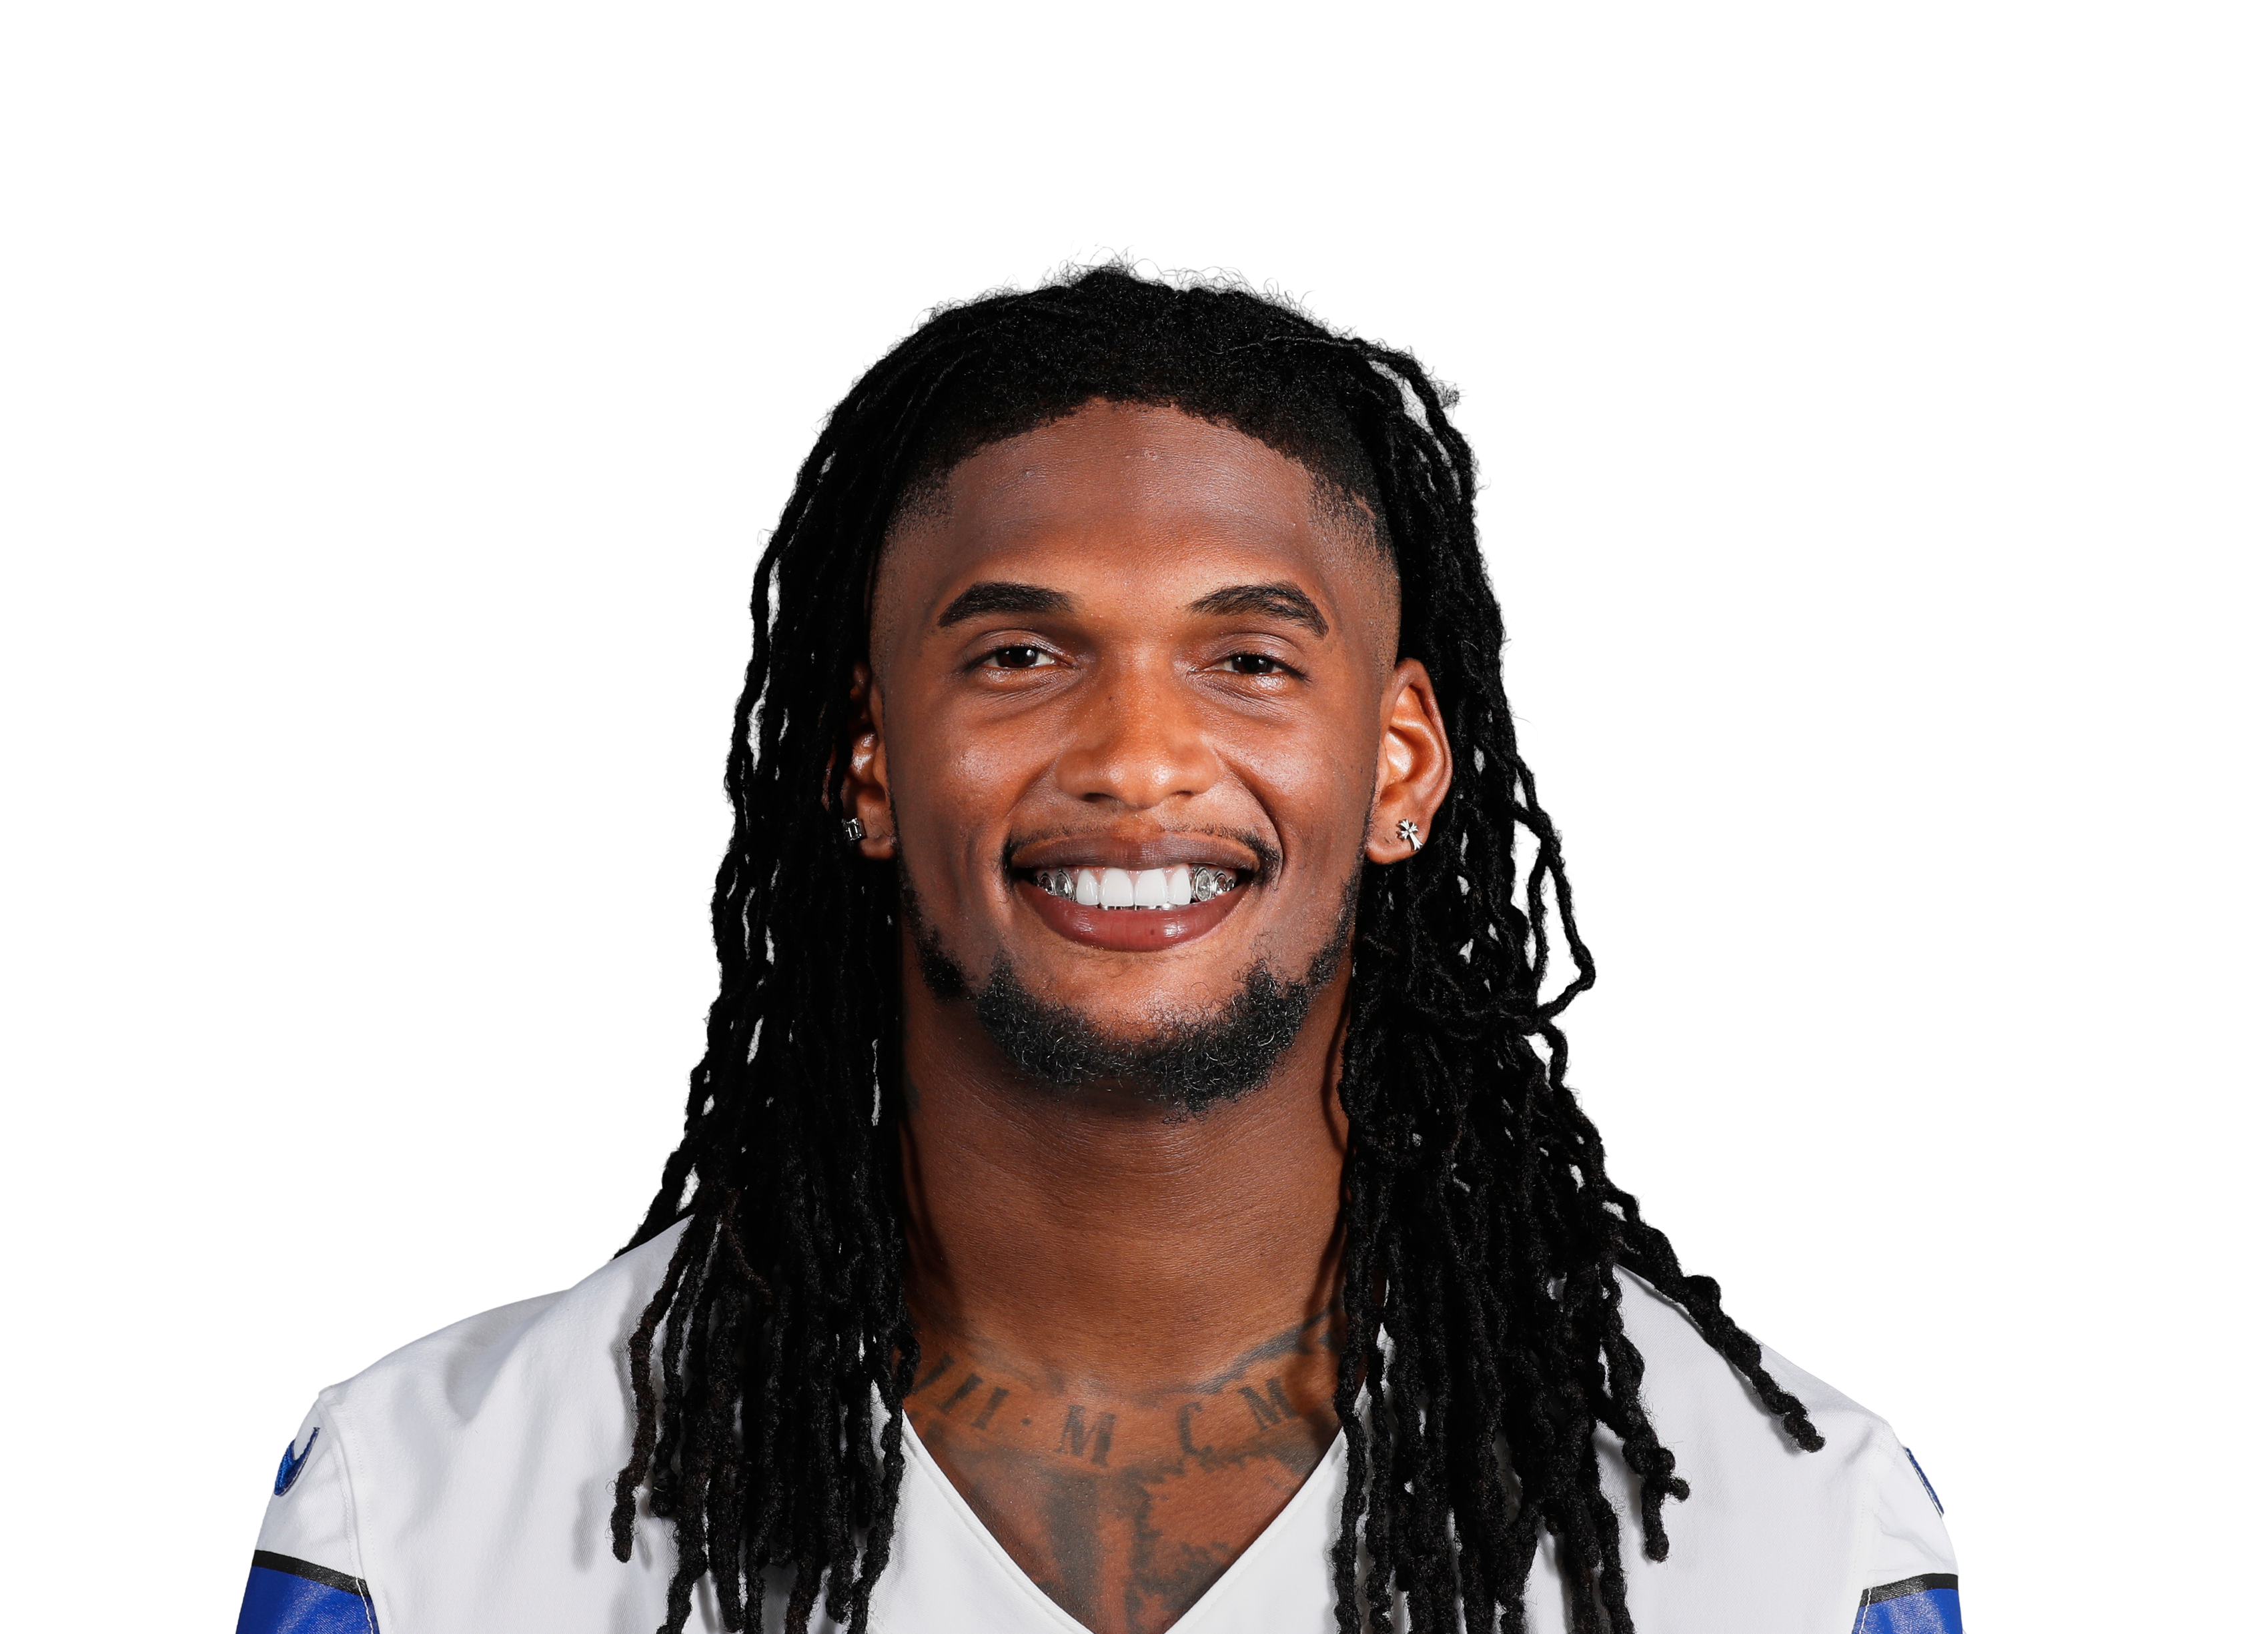
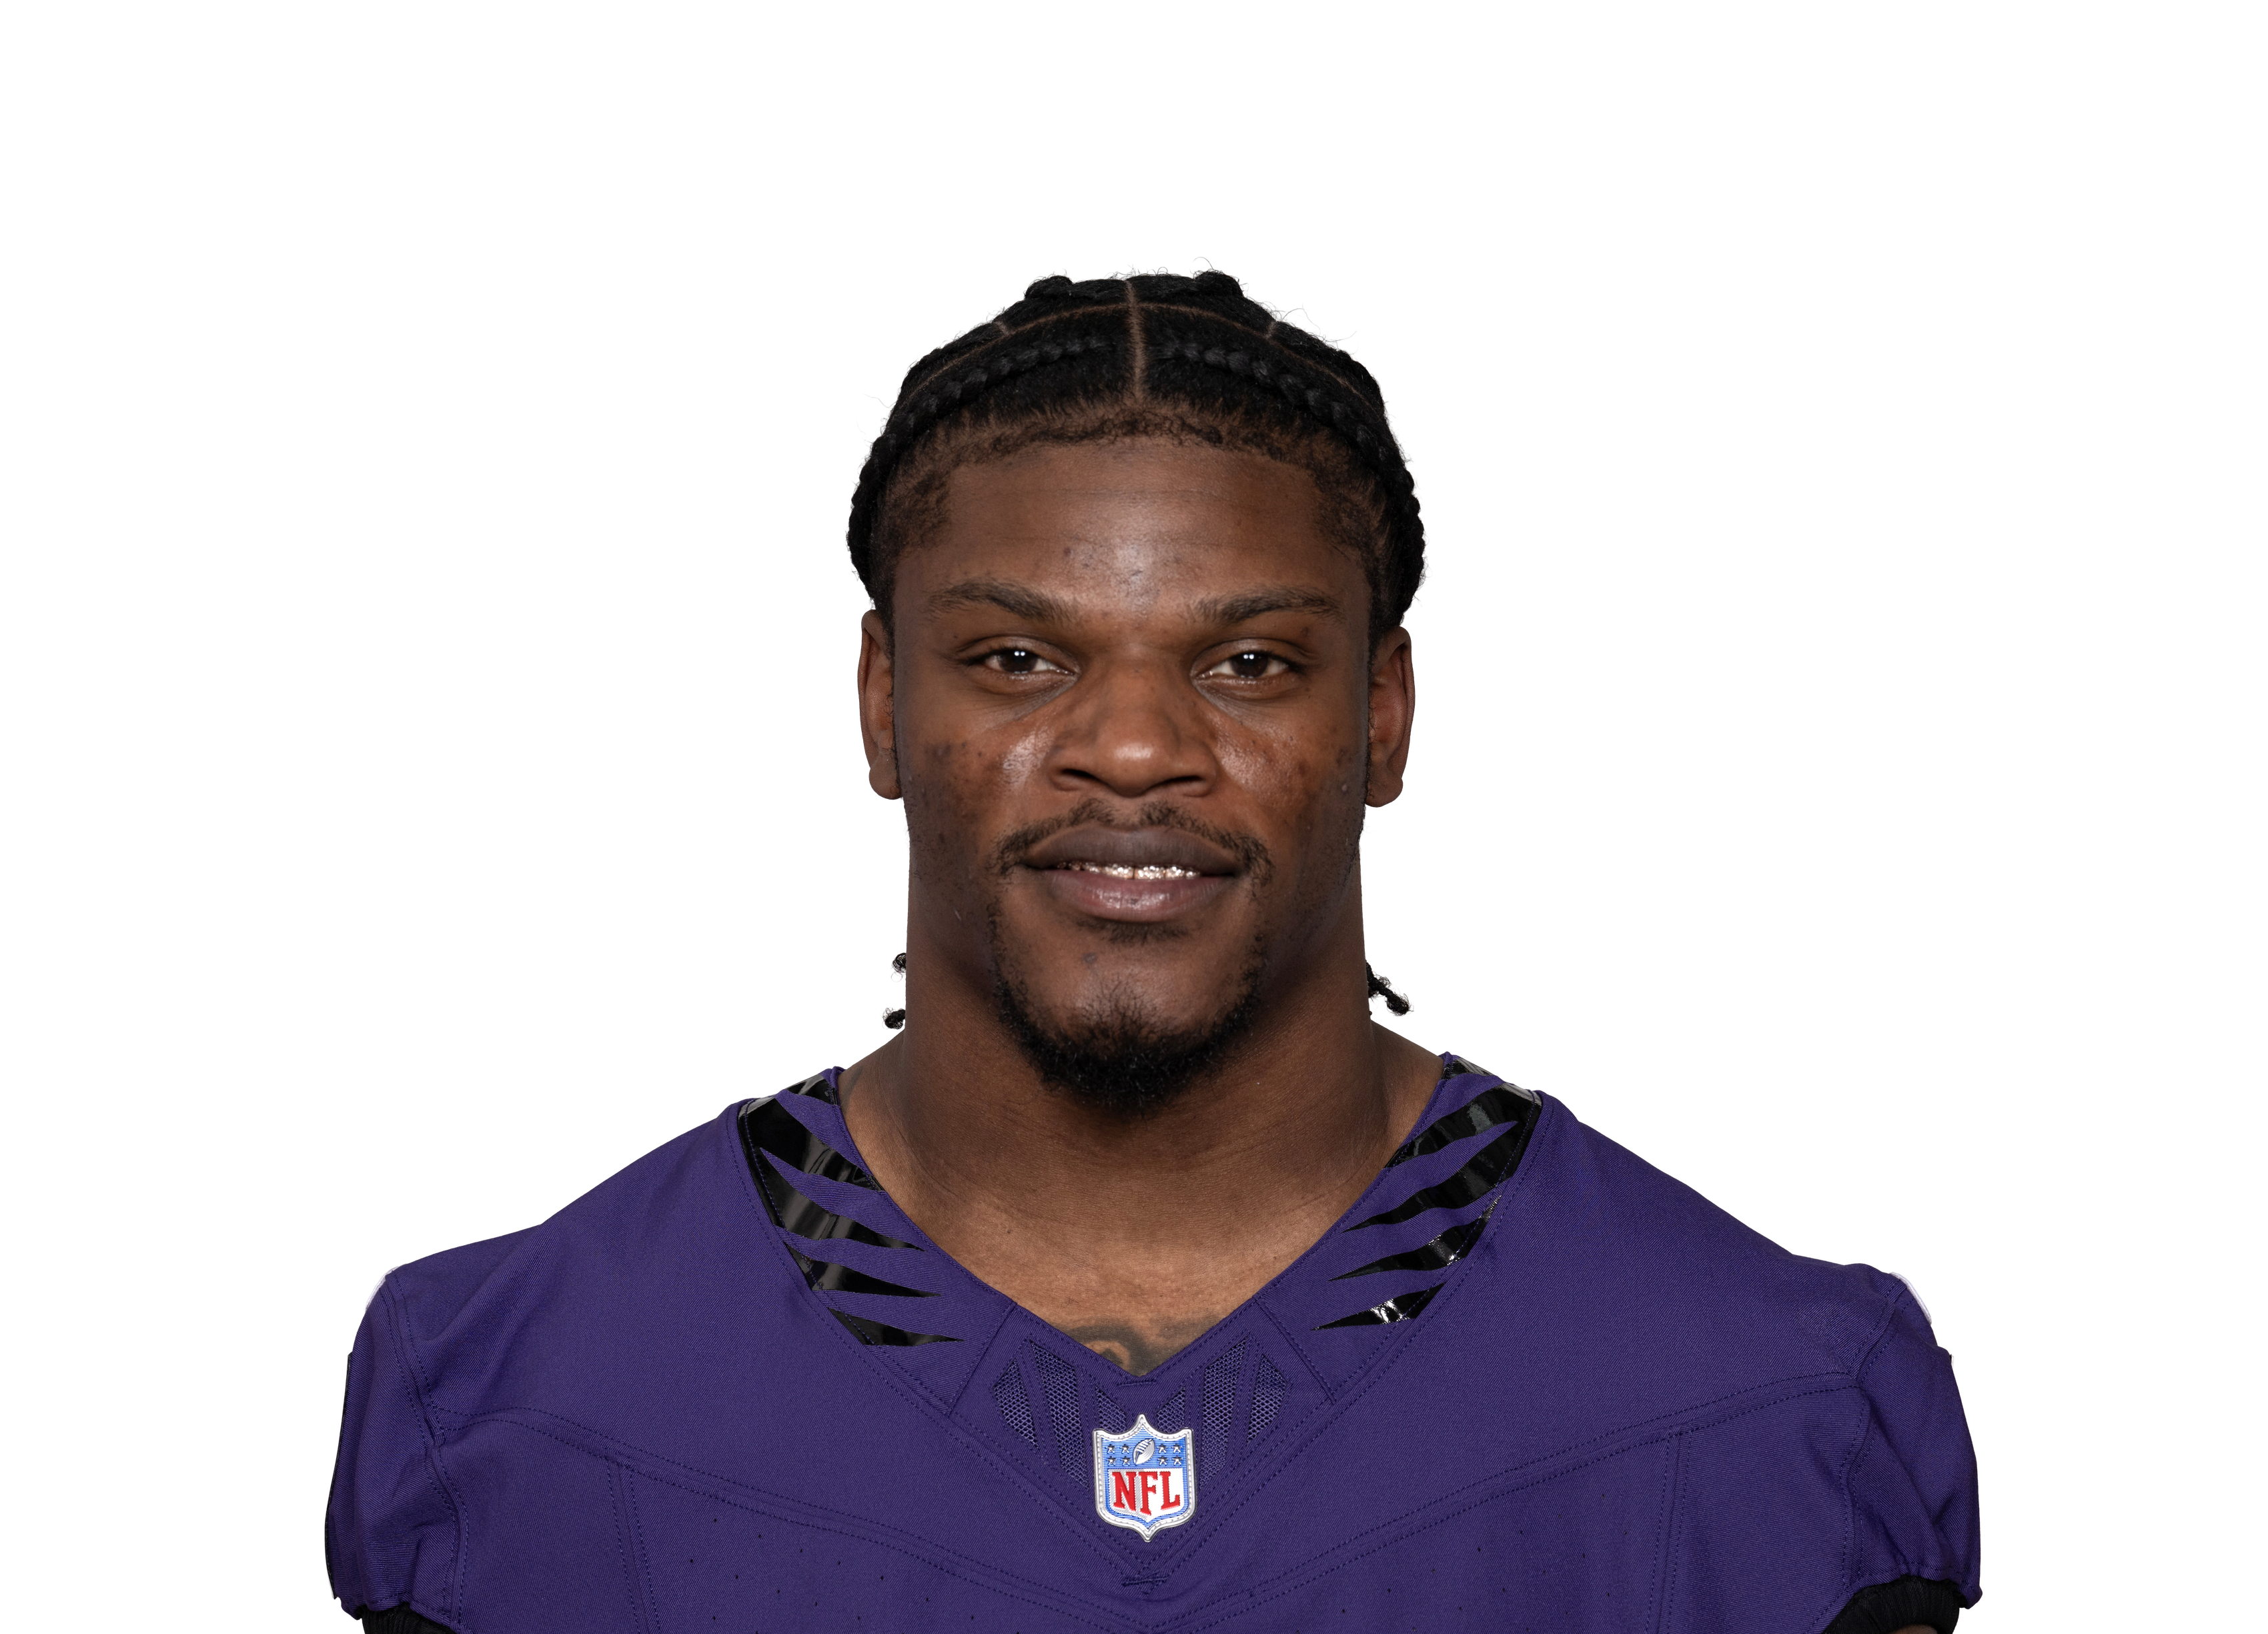
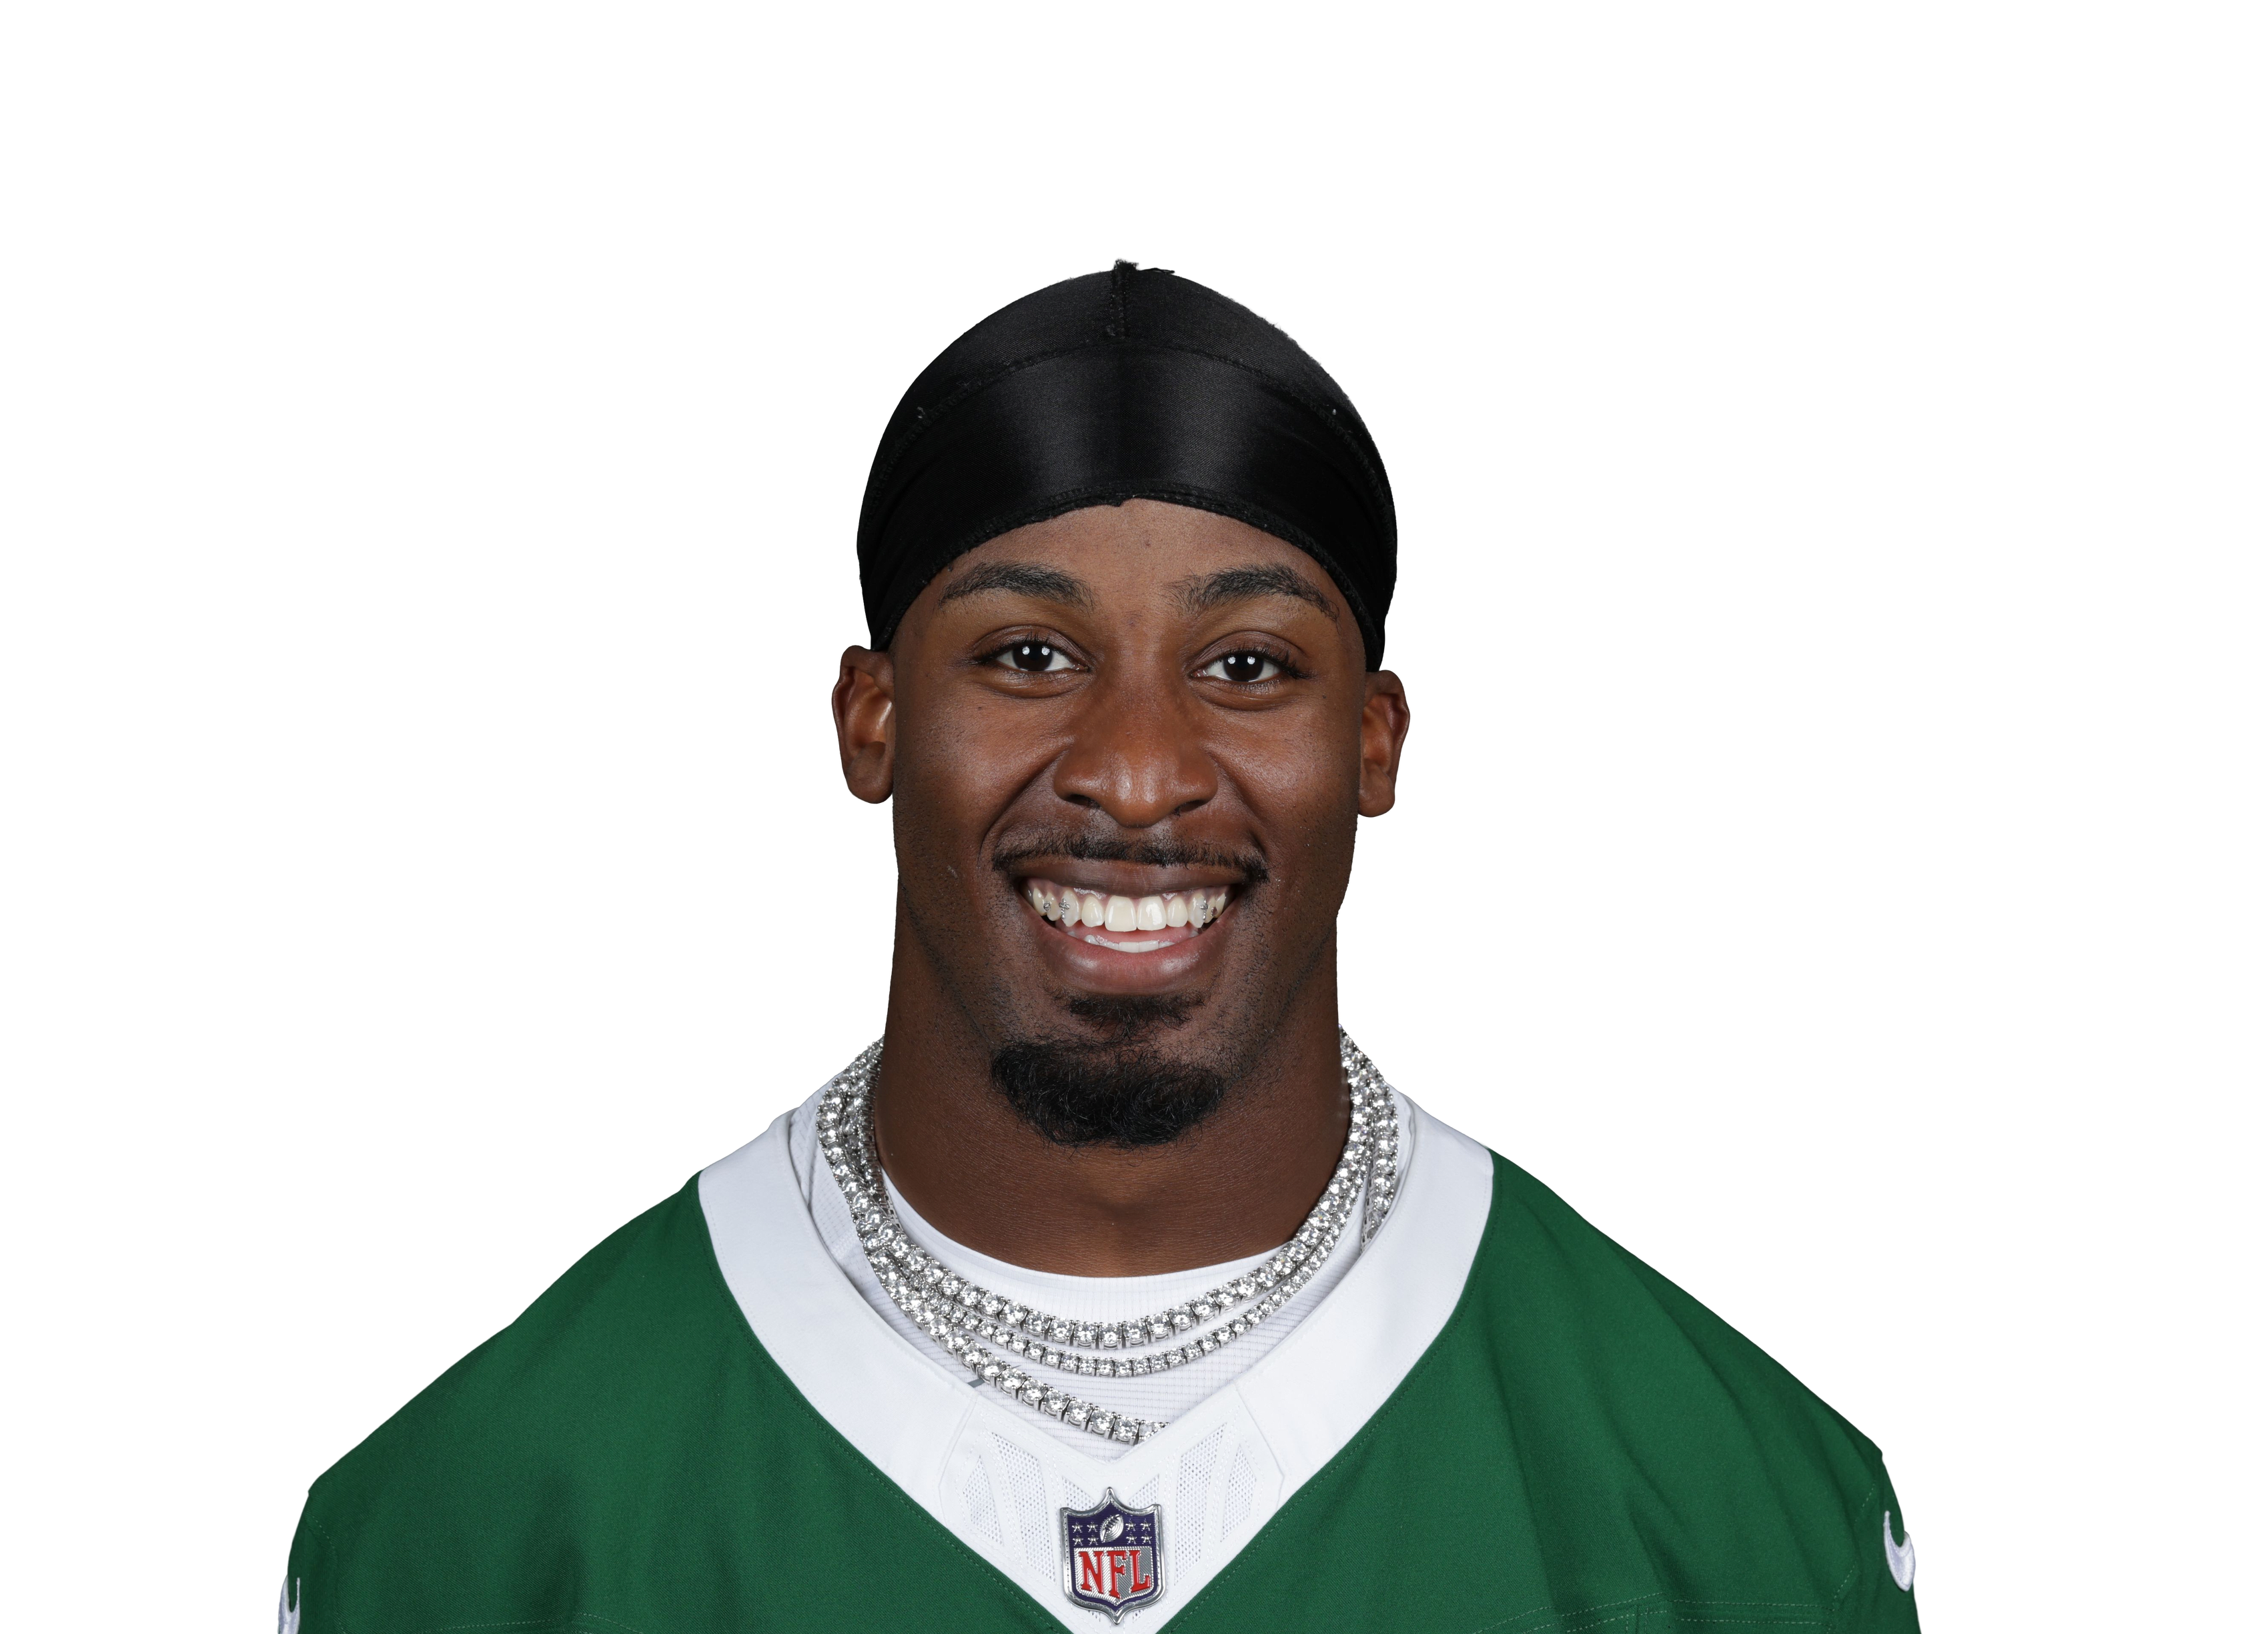
Performance ranks use shrunk competitive epa above a positional baseline. Offensive credit splits passing EPA between passer and receiver and excludes noncompetitive drives. It subtracts a positional 25th-percentile baseline and uses a 150-opportunity prior to reduce small-sample outliers. Defensive ranks use a descriptive box-stat index. These are separate measures and do not imply equal value across positions.